Customer journey mapping is a common analytical approach to understand the steps, processes, interactions, and brand touchpoints for the progression of a non-customer to a loyal advocate.
These are the same steps that a brand needs to progress through in order to maximize customer lifetime value: from new customer acquisition to highly loyal supportive customer (and, of course, all the steps in between).
Example CJM
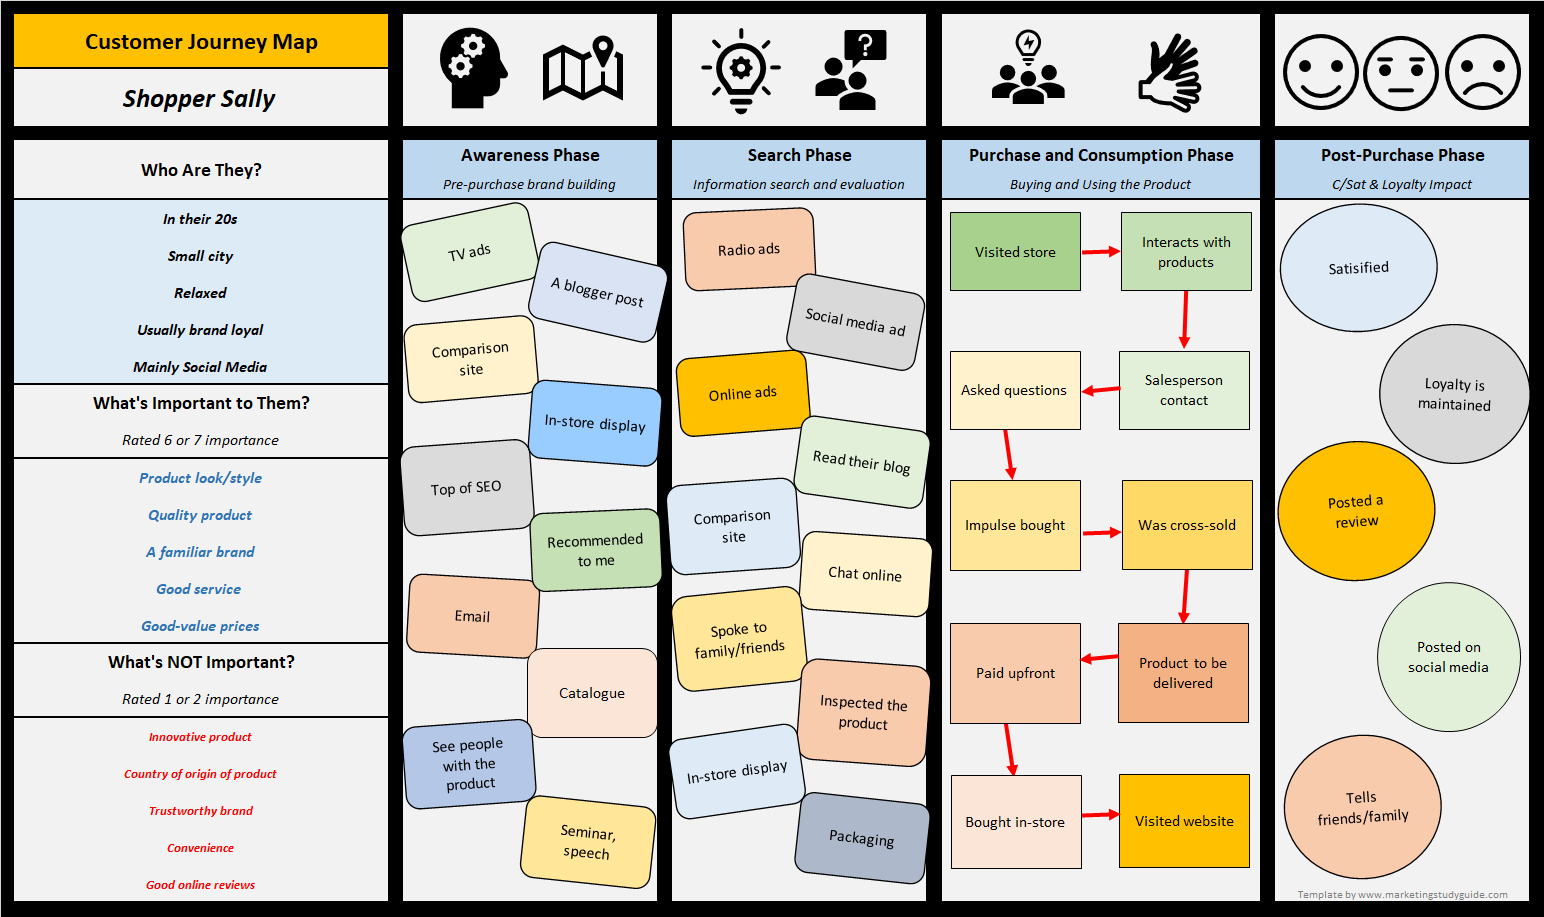
Here is an example customer journey map…
As you can see, for each brand persona (personified representative customer of a target market), there are four each phases of customer development”
Awareness phase = before the consumer has a desire/interest in buying the product
Search phase = when the consumer is seeking to buy the product and is seeking and reviewing information
Purchase and consumption phase = the process of the consumer finally buying (after evaluation) and then consuming the product
And post-purchase = what happens to the consumer – in terms of customer satisfaction, attitude, and brand loyalty after their purchase
For more information – please refer to this external article on the top-level phases of the customer journey.
CJM Free Excel Template
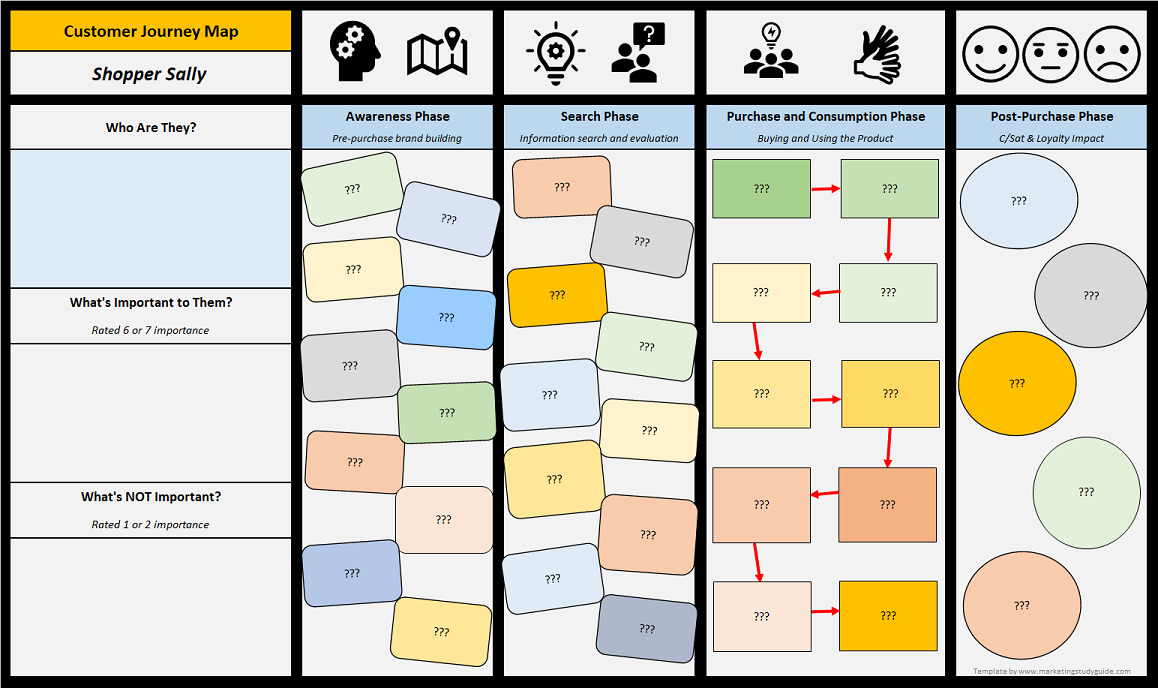
Designing a customer journey map – like the one above – is now super easy thanks to this free Excel template, available for download… customer-journey-map-maker
This is an easy-to-follow, drop-down menu template that can build a CJM within minutes – like the one shown above.
Here is an image of the starting “blank” CJM and underneath is a video of how to use the free customer journey map Excel template.
Customer equity is the total of all customer lifetime values of both current and future customers (please refer to this article for more information on how it is calculated).
This means that customer equity is a single measure of all future profits (on a discounted basis) that will be generated by the firm’s (or brand’s) customers.
Because this metric takes into account:
Profits from current customers
Profits from future customers
The “free” acquisition of customers from the firm’s previous brand building and other related marketing efforts
The expected degree of loyalty from customers
The level of profitability gained from customers – both of a short-term and long-term basis
The ongoing marketing investment in customer acquisition and retention
The time value of money (through using a discount)
Therefore, total customer equity is a metric that can measure the value and contribution of ALL marketing activities up to that point in time, taking into account both short-term and long-term expected profits from customers.
Customer equity is the sum of all customer lifetime values for a firm. In other words, we calculate each customer’s lifetime value and we total all of these values together to determine customer equity.
Customer equity, therefore, is the total expected profitability to be generated from a customer base over time.It is calculated using a compounding discount rate which allows us to consider the total expected profitability from our customer base in today’s dollars.
Should we include future customers in a customer equity calculation?
Existing customers are known to the organization – in that we know the current level of profit contribution, and we can estimate their retention/loyalty rate based upon our customer base history and analysis – which means that we can generally determine the customer lifetime value for each customer and then determine overall customer equity for the firm.
When we include customer is likely to be acquired in the future, we may have less information about them, but we can also make certain assumptions about their likely customer lifetime value based upon our existing customer base – which means that we have relatively reliable information to include future customers.
The reality is, that in today’s world of heavy social media usage, many businesses will gain new customers whether or not they engage in marketing-driven customer acquisition activities. This is because new customers will be attracted to the firm through referrals (both online and off-line), information they find online, then knowledge of the brand, independent research, and so on.
This means that, even if a firm stopped all their customer acquisition marketing activities, that they would continue to acquire new customers.
This is a strong case to always include future customers in the overall customer equity calculation, as the firm has earned these future customers due to their previous marketing activities and brand building efforts.
What is the customer equity formula?
Customer equity = sum of all customer lifetime values of the current and future customers
Note: as customer lifetime value should always be calculated using a discount rate, the above sum will provide the total expected profitability from current and future customers on a discounted basis as well.
An example of calculating customer equity
Assumptions for this example calculation
We start with a customer base of 1,000 customers
We “win” 100 new customers each year, even without customer acquisition actions
The profit we make from the average customer is $2,000 per annum
A 10% discount rate has been used
Note that we e are calculating customer equity assuming that the firm is NOT continuing to deliberately acquire news customers.
While this would not happen in practice, approaching the calculation in this manner is an effective way of measuring customer equity as it only takes into account marketing activities up until now.
Walk-through of the customer equity calculation
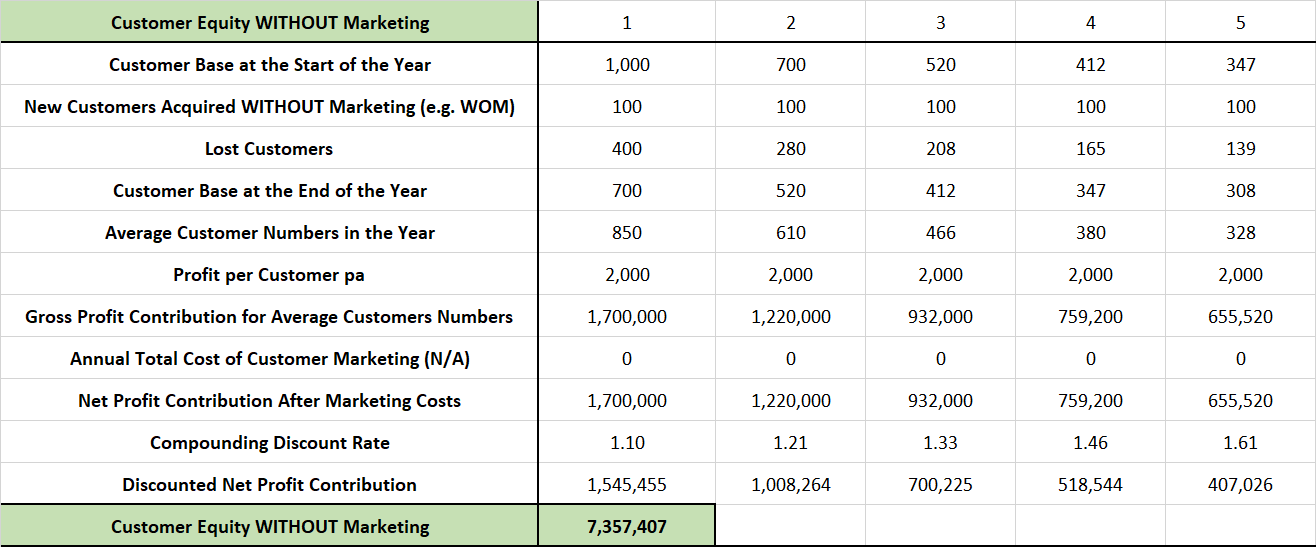
In this example, the retention rate is 60%, meaning that our churn rate is 40% – hence we lose 400 of 1,000 customers in the next year (year 1 of our calculation) and then 40% ongoing. However, this is slightly rectified due to our brand equity and we are likely to acquire 100 new customers each year, even without dedicated customer acquisition programs.
For this calculation, as we have a fluctuating number of customers each year, we can use the average number of customers in the year. In year 1 we start with 1,000 customers, but end the year with only 700 = 850 average customer base for the year.
Our 850 customers are then multiplied by the $2,000 pa per customer profit contribution, which equals $1,700,000 for the entire customer base. This figure is then discounted to 1,545,455 (to equate to a present day value).
We start the next year with 700 customers only (1,000 – 400 lost + 100 acquired) and we repeat the process with the same assumptions (but note that the discount rate compounds each year). This is continued ongoing (I use a 50 year horizon – please see this article on the rationale). And the sum of all the discounted profit contributions (e.g. 1,545,455 +1,008,264 + 700,225…) equals our total customer equity of $7,357,407.
Different customer equity calculations?
Please note that this website has an Excel template for calculating customer equity (available for free download), which calculates customer equity in three different ways.
Customer equity of both current and future customers, assuming continued customer acquisition marketing efforts,
Customer equity of both current and future customers, assuming no customer acquisition marketing efforts but some new customers from brand equity and related word-of-mouth, and
Customer equity of the existing customer base only, with no future customers considered.
Depending upon your measurement purpose, each customer equity calculation method has some merit and value.
The first method is similar to measuring the overall value of a business as a going concern as it is likely that successful marketing activities will be continued.
The second method measures the impact and success of all marketing efforts up to now in creating value and customer profitability for the firm.
And the third method is more suitable for a small business (with limited brand equity) that is unlikely to acquire new customers without any marketing efforts.
the average annual profit for this customer cohort is $60
and the average customer lifetime is three years.
The firm determines that the profit contribution is $180 before consideration of the initial acquisition cost (which means that CLV =$80).
CLV is calculated as (-$100 + ($60 X 3)) = $80 (please refersimple CLV formula).
In this case, the marketing ROI is ($80 / $100 = 80%). In other words, the marketing department has turned $100 into $180 by acquiring new customers.
Using Marketing ROI Instead of CLV
This approach may be preferred to the standard marketing ROI calculation because it looks at a longer time horizon. Let’s look at the same situation above, but this time only looking at a one-year horizon:
Average acquisition cost = $100
Average customer profit per year = $60
BUT the average customer lifetime period of 3 years is NOT considered in marketing ROI, because with a marketing ROI calculation, we generally only consider incremental results on a short-term basis, such as the first year only in this example.
This would mean that the marketing ROI would be calculated as:
Marketing ROI = (Improved profits less marketing costs)/marketing costs
Marketing ROI = ($60 – $100)/$100 = – 40%
When only ONE year is considered in marketing ROI (which is common practice when measuring a campaign with short-term results, then the ROI in our example is negative 40% – that is, we lost money for the firm.
The CLV calculation however, shows that the campaign had a positive contribution because profits from these customers continued for a further two years on average.
This means, particularly for marketing campaigns that deliver long-term results, calculating customer lifetime value will provide a better evaluation of marketing performance.