Customer Journey Mapping (CJM)

CJM a Helpful Analytical Tool for CLV

Customer journey mapping is a common analytical approach to understand the steps, processes, interactions, and brand touchpoints for the progression of a non-customer to a loyal advocate.

These are the same steps that a brand needs to progress through in order to maximize customer lifetime value: from new customer acquisition to highly loyal supportive customer (and, of course, all the steps in between).

Example CJM

Here is an example customer journey map…

example cjm

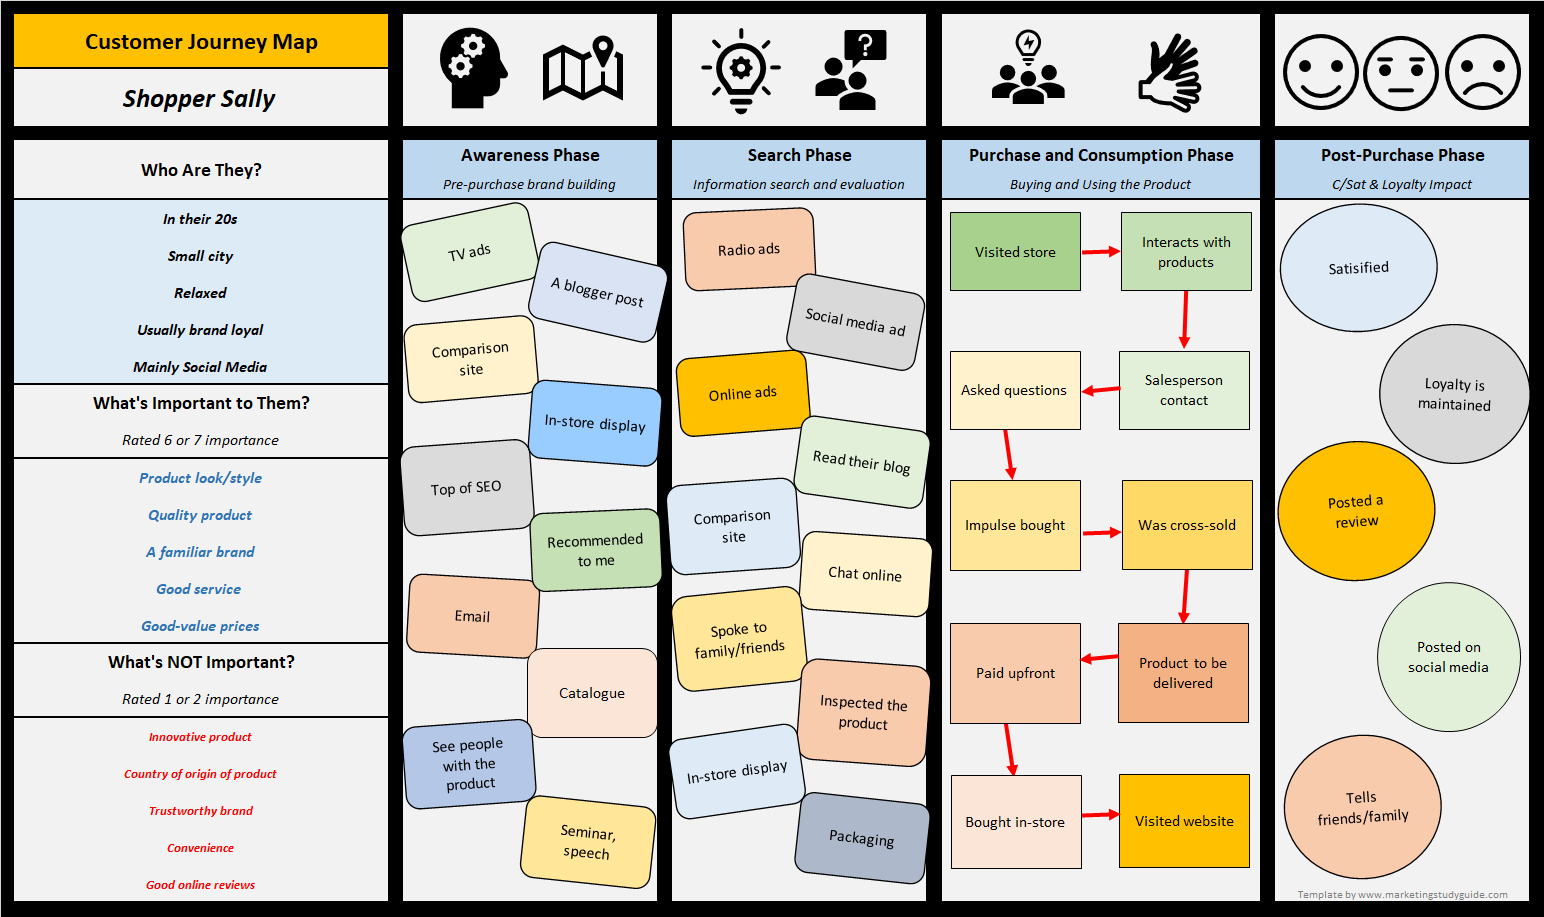
As you can see, for each brand persona (personified representative customer of a target market), there are four each phases of customer development”

  • Awareness phase = before the consumer has a desire/interest in buying the product
  • Search phase = when the consumer is seeking to buy the product and is seeking and reviewing information
  • Purchase and consumption phase = the process of the consumer finally buying (after evaluation) and then consuming the product
  • And post-purchase = what happens to the consumer – in terms of customer satisfaction, attitude, and brand loyalty after their purchase

For more information – please refer to this external article on the top-level phases of the customer journey.

CJM Free Excel Template

Designing a customer journey map – like the one above – is now super easy thanks to this free Excel template, available for download… customer-journey-map-maker

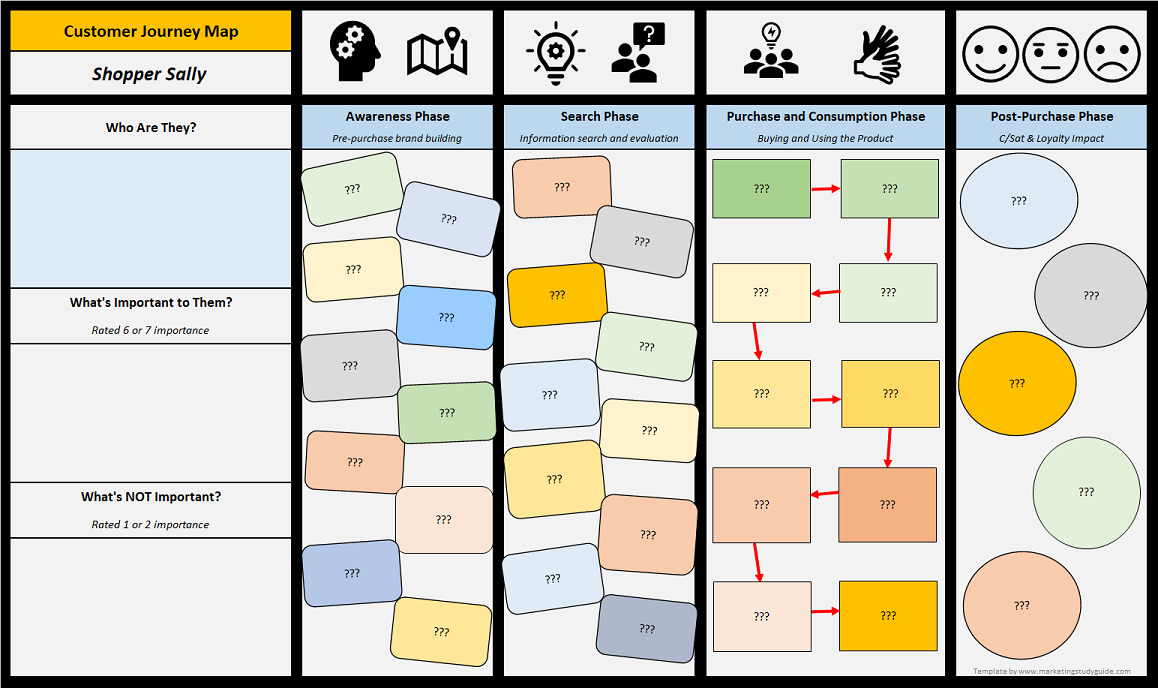
This is an easy-to-follow, drop-down menu template that can build a CJM within minutes – like the one shown above.

Here is an image of the starting “blank” CJM and underneath is a video of how to use the free customer journey map Excel template.

free CJM template

Further Academic Reading

Understanding Customer Experience Throughout the Customer Journey

What makes for CRM system success — or failure?

Customer retention rate should increase over time

One of the major impacts on overall customer lifetime value (CLV) is the firm’s ability to retain customers. An increased loyalty rate can substantially increase the average lifetime period of the customer, resulting in a significant increase in customer lifetime value.

However, it is unlikely that any cohort of customers will have a static retention rate. It is likely that retention will increase over time. You should note that the free template provided on this website to calculate customer lifetime value, allows you to modify the retention rate each year.

Obviously, for most firms/brands there is a natural goal to increase retention rate – but this will happen automatically in most cohorts of customers.

Example of increasing retention rate

Let’s assume we have acquired 100 customers in a particular year. Upon their first/early experiences with the firm/brand, they will go through some “customer satisfaction” (post purchase) evaluation. As you probably know, this is aligned to their expectations prior to purchase.

natural customer retention rate over timeLet’s assume that 25% of these new 100 customers are relatively dissatisfied with their purchase, with the remaining 75% relatively satisfied with their purchase.

You would probably guess that many of the 25% dissatisfied customers are unlikely to continue as customers into the second year – and you can probably also guess that a significant proportion of the 75% satisfied customers will remain loyal to the firm/brand.

If we enter the second year, say with a 60% retention rate – with all of these retained customers being part of the original satisfied group – therefore we held 60/75 of these satisfied customers and we lost all 25 dissatisfied customers.

Therefore, as we enter year three, we only have generally satisfied customers. While we had a 40% churn/loss rate in the first year – due to a proportion of new acquired customers being dissatisfied – they have left the firm/brand – and will not impact the retention rate of this customer cohort into year three.

This will mean that we are likely to see a significant jump in retention rate for this customer cohort – perhaps up to 80%. This process likely to continue, with the quite satisfied customers continuing and the less satisfied customers being more likely to drop off. Over time, the firm/brand should be left with a small, but loyal and quite satisfied, customer base – where retention keeps increasing.