
Perhaps one of the confusing aspects of calculating customer lifetime value (CLV) is working out the average period that a customer purchases from the firm/brand. Sometimes it seems inconsistent with the percentage of customers retained.
In this article, we will work through why this sometimes seems to be an inconsistency. For this example we will use an 80% retention rate. As we know, as this equates to a 20% churn rate, which is 1/5 as a fraction, making the average lifetime period for customers five years.
However, if we keep decreasing our customer base by 20% (the churn rate) each year, then at the end of the five years we only have around a third of the starting customers – so how can five years be the average period?
Let’s assume we start with 100 customers that are acquired in a particular year and our goal is to track this cohort’s customer lifetime value. With an 80% retention:
- 80 of them will continue into year two,
- 64 into year three,
- 51 into year four,
- 41 into year five, and
- by year six there are only 33 of the original 100 customers.
Therefore, the question is given we have only around one third of customers continuing past year five, how can the average lifetime period of this customer cohort be five years?
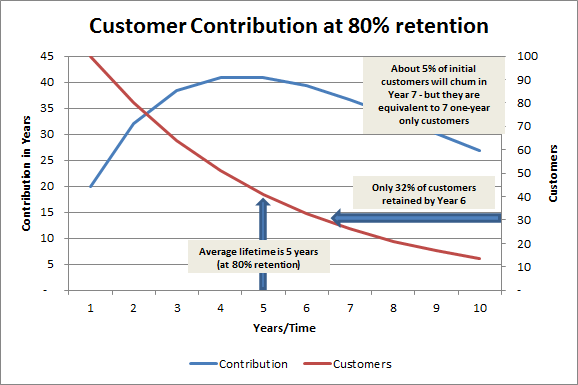 If we use the chart provided here – please note that the lines are mapped onto two different axes – you can see that the red line maps our 100 original customers on a progressively decreasing basis. And by year six there are around one third of the original customers still active with the firm/brand.
The blue line needs some slight explanation. The blue line represents the number of customers who leave in a particular year, multiplied by the number of years that they are a customer. For example, in year one we lose 20% of the 100 customers – and therefore 20 customers – they were only customers for one year.
However, in the second year we lose 20% of the remaining 80 customers – which is 16 customers. But as they were customers for two years, they were equivalent to 32 “single year only” customers. In year three, we lose a further 20% of the remaining 64 customers – which is about 13 customers – as they were customers for three years, they are equivalent to 39 “single year only” customers.
Therefore, the blue line maps the contribution – in terms of customer years – of the customers that are lost in that particular time period. As you can see, the blue line peaks around years four and five, indicating that the average of customers will be dragged towards four or five years’ worth of value (as opposed to a single year only customer).
The other factor to consider is the long tail of the red line. As you can see, it is somewhat flattening out, meaning that they customers remaining are relatively loyal, and are likely to be long-term customers. For example, in year seven, we only lose 5% of our original 100 customers. These five customers, have been dealing with the firm/brand for seven years. As you can see, we still have 15 to 20% of customers dealing with us up until you 10 – and beyond – which has the impact of extending the average lifetime period (essentially as a weighted average) to five years.
Related topics