How to calculate customer lifetime period with a fluctuating retention rate

Customer lifetime period

This is the amount of time that the average customer (or customer segment) remains an active customer with a firm; it is typically measured in years.

When a business has a very stable customer retention rate every year, regardless of the length of loyalty of the customer base or improvements and modifications to customer acquisition and retention – then the calculation of the customer lifetime period is very straightforward using a set formula, which is discussed in this article on calculating the customer lifetime period.

Fluctuating customer retention rates

In business reality, it is unlikely that the retention rate = customer loyalty – will remain constant each year. There are several factors why this is the case, such as:

  • Different marketing campaigns and incentives bring in new customers with likely different loyalty patterns over time
  • The company itself will try to build and enhance loyalty over time, by improving service or through loyalty incentives

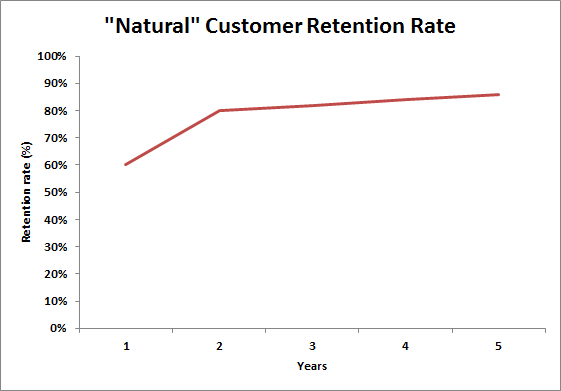
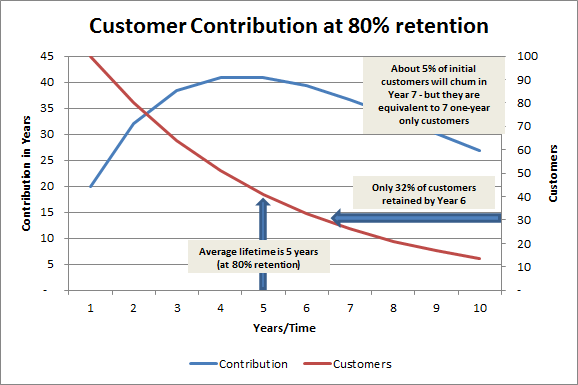
But most importantly, customers who remain loyal for one year or more appear to have a good degree of satisfaction with the firm. In other words, dissatisfied customers are more likely to churn within the early stages of their relationship. The following diagram highlights the most likely pattern of customer loyalty and retention over time for most firms:

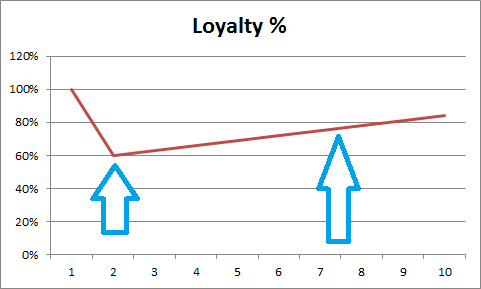
As you can see, there is a 60% retention rate from year 1 to year 2, which gradually increases to over 80% over time. This is a relatively typical pattern of customer loyalty to the factors outlined above.

Calculating the customer lifetime period with a increasing retention rate

As there are different retention rates to consider for each year of the customer relationship, we can no longer use the formula (please see the article link above) and we need to do a manual, but simple, calculation.

Let’s review the following table:

how to calculate customer lifetime period with a changing retention rate

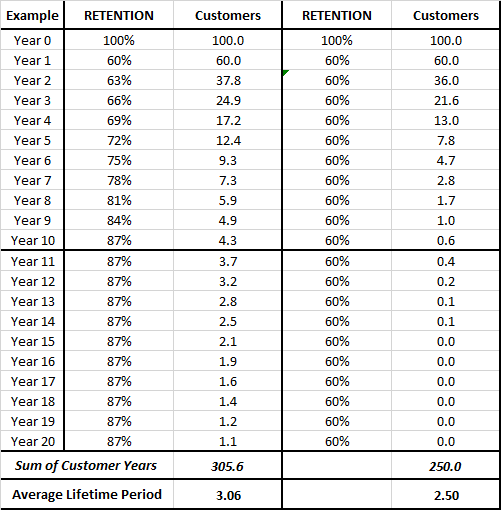
There is to example shown above. On the left-hand side we have a firm that has increasing retention rate – starting at 60% in the first year, but then increasing progressively to 87% by the end of year 10.

For the simplicity of the calculation, I have assumed that 87% is the maximum retention rate that will be reached. As you can see, by the end of year 20, the firm is only likely to have 1 customer remaining out of 100.

The key calculation occurs in the “customers” column, where we start with a set of 100 customers and then apply the loyalty percentage progressively to work out how many customers we expect to have remaining the following year.

For example, in year one we have a 60% retention = 60 out of 100 customers. In the following year, the retention rate increases to 63%, which means that we will have 63% of the remaining 60 customers = 37.8 customers.

Please note the decimals are used as this is a forecast of likely customers (like a probability measure) – obviously we can’t have 0.8 of the customer.

We continue the calculation down for the full 20 years – or a suitable time period for the business involved, which may be shorter. And then we sum that column of numbers.

In this example, the sum is 305.6 years. This equates to 305.6 total customer years across the 100 customers that we started with. Then we simply divide 305.6 total years by the starting 100 customers, we get an average customer lifetime period of 3.056 (or 3.06 rounded).

The example shown in the other columns on the right, are calculated the same way – except this time with a flat retention rate, to demonstrate that the calculation is correct.

If we have a flat 60% retention rate, then our churn/loss rate is 40% – and using the formula we can determine that the average customer lifetime value period is 2.5 years.

Lifetime period = 1/(1 – retention rate) = 1/(churn rate)

For this example, the lifetime period is 1/0.4  = 2.5 years – which is a match to the above calculated table.

Helpful instructional video on the above table

Customer Journey Mapping (CJM)

CJM a Helpful Analytical Tool for CLV

Customer journey mapping is a common analytical approach to understand the steps, processes, interactions, and brand touchpoints for the progression of a non-customer to a loyal advocate.

These are the same steps that a brand needs to progress through in order to maximize customer lifetime value: from new customer acquisition to highly loyal supportive customer (and, of course, all the steps in between).

Example CJM

Here is an example customer journey map…

example cjm

As you can see, for each brand persona (personified representative customer of a target market), there are four each phases of customer development”

  • Awareness phase = before the consumer has a desire/interest in buying the product
  • Search phase = when the consumer is seeking to buy the product and is seeking and reviewing information
  • Purchase and consumption phase = the process of the consumer finally buying (after evaluation) and then consuming the product
  • And post-purchase = what happens to the consumer – in terms of customer satisfaction, attitude, and brand loyalty after their purchase

For more information – please refer to this external article on the top-level phases of the customer journey.

CJM Free Excel Template

Designing a customer journey map – like the one above – is now super easy thanks to this free Excel template, available for download… customer-journey-map-maker

This is an easy-to-follow, drop-down menu template that can build a CJM within minutes – like the one shown above.

Here is an image of the starting “blank” CJM and underneath is a video of how to use the free customer journey map Excel template.

free CJM template

Further Academic Reading

Understanding Customer Experience Throughout the Customer Journey

What makes for CRM system success — or failure?

Why Customer Equity is a Powerful Marketing Metric

Customer equity is the total of all customer lifetime values of both current and future customers (please refer to this article for more information on how it is calculated).

This means that customer equity is a single measure of all future profits (on a discounted basis) that will be generated by the firm’s (or brand’s) customers.

Because this metric takes into account:

  • Profits from current customers
  • Profits from future customers
  • The “free” acquisition of customers from the firm’s previous brand building and other related marketing efforts
  • The expected degree of loyalty from customers
  • The level of profitability gained from customers – both of a short-term and long-term basis
  • The ongoing marketing investment in customer acquisition and retention
  • The time value of money (through using a discount)

Therefore, total customer equity is a metric that can measure the value and contribution of ALL marketing activities up to that point in time, taking into account both short-term and long-term expected profits from customers.

Related topics

Calculating customer equity

Free Excel template: customer equity calculator


What is Customer Equity?

Defining Customer Equity

Customer equity is the sum of all customer lifetime values for a firm. In other words, we calculate each customer’s lifetime value and we total all of these values together to determine customer equity.

Customer equity, therefore, is the total expected profitability to be generated from a customer base over time.It is calculated using a compounding discount rate which allows us to consider the total expected profitability from our customer base in today’s dollars.

Should we include future customers in a customer equity calculation?

Existing customers are known to the organization – in that we know the current level of profit contribution, and we can estimate their retention/loyalty rate based upon our customer base history and analysis – which means that we can generally determine the customer lifetime value for each customer and then determine overall customer equity for the firm.

When we include customer is likely to be acquired in the future, we may have less information about them, but we can also make certain assumptions about their likely customer lifetime value based upon our existing customer base – which means that we have relatively reliable information to include future customers.

The reality is, that in today’s world of heavy social media usage, many businesses will gain new customers whether or not they engage in marketing-driven customer acquisition activities. This is because new customers will be attracted to the firm through referrals (both online and off-line), information they find online, then knowledge of the brand, independent research, and so on.

This means that, even if a firm stopped all their customer acquisition marketing activities, that they would continue to acquire new customers.

This is a strong case to always include future customers in the overall customer equity calculation, as the firm has earned these future customers due to their previous marketing activities and brand building efforts.

What is the customer equity formula?

Customer equity = sum of all customer lifetime values of the current and future customers

Note: as customer lifetime value should always be calculated using a discount rate, the above sum will provide the total expected profitability from current and future customers on a discounted basis as well.

An example of calculating customer equity

Assumptions for this example calculation

  • We start with a customer base of 1,000 customers
  • We “win” 100 new customers each year, even without customer acquisition actions
  • The profit we make from the average customer is $2,000 per annum
  • A 10% discount rate has been used

Note that we e are calculating customer equity assuming that the firm is NOT continuing to deliberately acquire news customers.

While this would not happen in practice, approaching the calculation in this manner is an effective way of measuring customer equity as it only takes into account marketing activities up until now.

Walk-through of the customer equity calculation

In this example, the retention rate is 60%, meaning that our churn rate is 40% – hence we lose 400 of 1,000 customers in the next year (year 1 of our calculation) and then 40% ongoing. However, this is slightly rectified due to our brand equity and we are likely to acquire 100 new customers each year, even without dedicated customer acquisition programs.

For this calculation, as we have a fluctuating number of customers each year, we can use the average number of customers in the year. In year 1 we start with 1,000 customers, but end the year with only 700 = 850 average customer base for the year.

Our 850 customers are then multiplied by the $2,000 pa per customer profit contribution, which equals $1,700,000 for the entire customer base. This figure is then discounted to 1,545,455 (to equate to a present day value).

We start the next year with 700 customers only (1,000 – 400 lost + 100 acquired) and we repeat the process with the same assumptions (but note that the discount rate compounds each year). This is continued ongoing (I use a 50 year horizon – please see this article on the rationale). And the sum of all the discounted profit contributions (e.g. 1,545,455 +1,008,264 + 700,225…) equals our total customer equity of $7,357,407.

Different customer equity calculations?

Please note that this website has an Excel template for calculating customer equity (available for free download), which calculates customer equity in three different ways.

  1. Customer equity of both current and future customers, assuming continued customer acquisition marketing efforts,
  2. Customer equity of both current and future customers, assuming no customer acquisition marketing efforts but some new customers from brand equity and related word-of-mouth, and
  3. Customer equity of the existing customer base only, with no future customers considered.

Depending upon your measurement purpose, each customer equity calculation method has some merit and value.

The first method is similar to measuring the overall value of a business as a going concern as it is likely that successful marketing activities will be continued.

The second method measures the impact and success of all marketing efforts up to now in creating value and customer profitability for the firm.

And the third method is more suitable for a small business (with limited brand equity) that is unlikely to acquire new customers without any marketing efforts.

Related Topics

The free Excel template for calculating customer equity

Why customer equity is a powerful metric

Free template for mapping the customer journey

Customer Lifetime Value (CLV) may be more appropriate than Marketing ROI

Using CLV to determine Marketing ROI

Let’s assume that:

  • the average customer acquisition cost for a company is $100
  • the average annual profit for this customer cohort is $60
  • and the average customer lifetime is three years.

The firm determines that the profit contribution is $180 before consideration of the initial acquisition cost (which means that CLV =$80).

In this case, the marketing ROI is ($80 / $100 = 80%). In other words, the marketing department has turned $100 into $180 by acquiring new customers.

Using Marketing ROI Instead of CLV

This approach may be preferred to the standard marketing ROI calculation because it looks at a longer time horizon. Let’s look at the same situation above, but this time only looking at a one-year horizon:

  • Average acquisition cost = $100
  • Average customer profit per year = $60

BUT the average customer lifetime period of 3 years is NOT considered in marketing ROI, because with a marketing ROI calculation, we generally only consider incremental results on a short-term basis, such as the first year only in this example.

This would mean that the marketing ROI would be calculated as:

  • Marketing ROI =          (Improved profits less marketing costs)/marketing costs
  • Marketing ROI =          ($60 – $100)/$100 = – 40%

When only ONE year is considered in marketing ROI (which is common practice when measuring a campaign with short-term results, then the ROI in our example is negative 40% – that is, we lost money for the firm.

The CLV calculation however, shows that the campaign had a positive contribution because profits from these customers continued for a further two years on average.

This means, particularly for marketing campaigns that deliver long-term results, calculating customer lifetime value will provide a better evaluation of marketing performance.

Great Article on CLV for Mobil Apps


evus TECHNOLOGIES has a great article on various ways of measuring and tracking the performance of a mobile app. They review 50 different KPIs (key performance indicators) that are relevant to mobile app metrics, including a look at customer lifetime value, retention rate, and customer acquisition cost.

So if you have a special interest in CLV for your mobile app – then check out their article Top 50 KPIs for Mobile Apps.

Here is a short excerpt from the opening of their article, to give you a sense of why it’s an important read…

Understanding the various mobile KPIs (key performance indicators) and how they apply to your business should be the first steps you take when developing a plan for marketing, promoting, and ensuring the success of your app.

Regular reporting and analysis of mobile app marketing KPIs and how your app is progressing helps you improve upon its performance and therefore generate more revenue.

It helps you place a valuation on your app and therefore attract the attention and resources of buyers, investors, and shareholders.

Defining unique KPIs means determining what a good performance looks like and how to capture and measure the various indicators along the journey.

But of course, there are nearly as many mobile app metrics as there are apps, so understanding what it all means is perhaps the first step in the process.

Customer retention rate should increase over time

One of the major impacts on overall customer lifetime value (CLV) is the firm’s ability to retain customers. An increased loyalty rate can substantially increase the average lifetime period of the customer, resulting in a significant increase in customer lifetime value.

However, it is unlikely that any cohort of customers will have a static retention rate. It is likely that retention will increase over time. You should note that the free template provided on this website to calculate customer lifetime value, allows you to modify the retention rate each year.

Obviously, for most firms/brands there is a natural goal to increase retention rate – but this will happen automatically in most cohorts of customers.

Example of increasing retention rate

Let’s assume we have acquired 100 customers in a particular year. Upon their first/early experiences with the firm/brand, they will go through some “customer satisfaction” (post purchase) evaluation. As you probably know, this is aligned to their expectations prior to purchase.

natural customer retention rate over timeLet’s assume that 25% of these new 100 customers are relatively dissatisfied with their purchase, with the remaining 75% relatively satisfied with their purchase.

You would probably guess that many of the 25% dissatisfied customers are unlikely to continue as customers into the second year – and you can probably also guess that a significant proportion of the 75% satisfied customers will remain loyal to the firm/brand.

If we enter the second year, say with a 60% retention rate – with all of these retained customers being part of the original satisfied group – therefore we held 60/75 of these satisfied customers and we lost all 25 dissatisfied customers.

Therefore, as we enter year three, we only have generally satisfied customers. While we had a 40% churn/loss rate in the first year – due to a proportion of new acquired customers being dissatisfied – they have left the firm/brand – and will not impact the retention rate of this customer cohort into year three.

This will mean that we are likely to see a significant jump in retention rate for this customer cohort – perhaps up to 80%. This process likely to continue, with the quite satisfied customers continuing and the less satisfied customers being more likely to drop off. Over time, the firm/brand should be left with a small, but loyal and quite satisfied, customer base – where retention keeps increasing.

Customer lifetime value – does the average lifetime period make sense?


Perhaps one of the confusing aspects of calculating customer lifetime value (CLV) is working out the average period that a customer purchases from the firm/brand. Sometimes it seems inconsistent with the percentage of customers retained.

In this article, we will work through why this sometimes seems to be an inconsistency. For this example we will use an 80% retention rate. As we know, as this equates to a 20% churn rate, which is 1/5 as a fraction, making the average lifetime period for customers five years.

However, if we keep decreasing our customer base by 20% (the churn rate) each year, then at the end of the five years we only have around a third of the starting customers – so how can five years be the average period?

Let’s assume we start with 100 customers that are acquired in a particular year and our goal is to track this cohort’s customer lifetime value. With an 80% retention:

  • 80 of them will continue into year two,
  • 64 into year three,
  • 51 into year four,
  • 41 into year five, and
  • by year six there are only 33 of the original 100 customers.

Therefore, the question is given we have only around one third of customers continuing past year five, how can the average lifetime period of this customer cohort be five years?

clv customer contributionIf we use the chart provided here – please note that the lines are mapped onto two different axes – you can see that the red line maps our 100 original customers on a progressively decreasing basis. And by year six there are around one third of the original customers still active with the firm/brand.

The blue line needs some slight explanation. The blue line represents the number of customers who leave in a particular year, multiplied by the number of years that they are a customer. For example, in year one we lose 20% of the 100 customers – and therefore 20 customers – they were only customers for one year.

However, in the second year we lose 20% of the remaining 80 customers – which is 16 customers. But as they were customers for two years, they were equivalent to 32 “single year only” customers. In year three, we lose a further 20% of the remaining 64 customers – which is about 13 customers – as they were customers for three years, they are equivalent to 39 “single year only” customers.

Therefore, the blue line maps the contribution – in terms of customer years – of the customers that are lost in that particular time period. As you can see, the blue line peaks around years four and five, indicating that the average of customers will be dragged towards  four or five years’ worth of value (as opposed to a single year only customer).

The other factor to consider is the long tail of the red line. As you can see, it is somewhat flattening out, meaning that they customers remaining are relatively loyal, and are likely to be long-term customers. For example, in year seven, we only lose 5% of our original 100 customers. These five customers, have been dealing with the firm/brand for seven years. As you can see, we still have 15 to 20% of customers dealing with us up until you 10 – and beyond – which has the impact of extending the average lifetime period (essentially as a weighted average) to five years.

Related topics

Main customer lifetime value formula