When calculating customer lifetime value (CLV), one of the key inputs is the number of years that the average customer will purchase from the firm. This is surprisingly easy to calculate if you know the loyalty/retention rate of customers.
The formula for average lifetime period of customers is simply 1/(1-retention rate). Please note that this works perfectly for fixed retention rates, otherwise see this article on calculating the customer lifetime period for fluctuating retention rates (which would be the norm in a real business).
For example, an 80% loyalty/retention rate means that 20% of customers are lost (churned). And a 60% loyalty/retention rate means that 40% of customers are lost/churned. In all cases, the retention and the churn rate should add up to 100% to account for all the customers.
If we relook at the above formula for average lifetime period, then it could be further simplified as 1/churn rate. And if we convert the churn rate to a simple fraction, then we can quickly work out the average lifetime period as follows:
20% churn rate = 1/5 = average lifetime period = 5 years
33% churn rate = 1/3 = average lifetime period = 3 years
50% churn rate = ½ = average lifetime period = 2 years
Hopefully what you should notice, is when we convert the churn rate to a simple fraction – where we have 1 as the numerator (top number), we can simply take the bottom number (the denominator) as the number of years.
This occurs because, as we divide the fraction into one, the calculation has the impact of inverting the fraction.
Therefore, if you remember your approach to dividing fractions, you should be able to work out the average lifetime period for any fraction – by inverting the fraction. And you may recall from mathematics, that to divide a fraction you turn it over and multiply it. Because we are dividing into one, we end up multiplying by one – so all we have to do is invert the fraction.
For example, if we have a 30% churn rate, as a fraction that is 3/10. When we invert that we get 10/3 – which is equivalent to 3.33 years.
Likewise, if we have a 40% churn rate, that is equivalent to 2/5 – we then invert it and get 5/2, which is equal to 2.5 years.
A fairly standard CLV formula that you will find for measuring the lifetime value of existing customers is:
CLV = (m.r)/(1+d-r)
Where m = customer margin (or profit contribution) per year
Where d = discount rate
And r = retention/loyalty rate per year
Important note: This formula is designed to measure the customer lifetime value of EXISTING customers only. You should also note that there is NO use of an acquisition cost, as existing customers have already been acquired and that expense is now historical (or a sunken cost).
How this CLV formula for existing customers works
To make sense of what this formula is doing, let’s first look at the bottom line of 1+d-r, but remove the discount rate (d) and we are now left with 1-r.
We should know that 1 minus the retention rate is churn (or customer loss) rate. When we use the churn rate at the bottom (denominator) of the fraction/equation, we are actually calculating the lifetime period of a customer in years.
For example, a 60% loyalty rate = 40% churn/loss = 1/0.4 = 2.5 years, and
An 80% loyalty rate = 20% churn/loss = 1/0.2 = 5 years
Now let’s look at the impact of the retention rate at the top of the equation. At the top of this CLV formula (numerator) there is m times r. This has the immediate impact of reducing the margin (profit) to the likely margin be be achieved in the FOLLOWING year.
This occurs because the formula is looking at an existing customer (already acquired) and estimating their FUTURE value – not their total value over the course of their customer relationship.
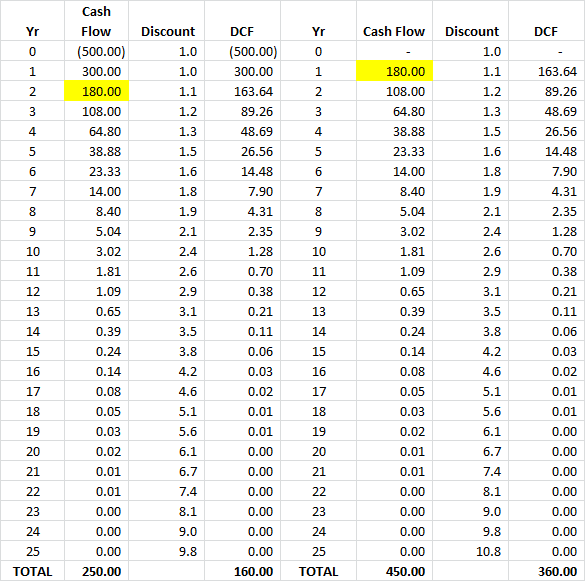
Click CLV table to enlarge
To make sense of this difference, let’s compare a new customer’s CLV to an existing customer.
The new customer is shown on the left hand side. As you can see, their acquisition cost was $500 in Year 0, their margin was $300 in Year 1, which then reduces by 60% each year in line with estimated retention rates.
After the 10% discount rate, their CLV (shown as DCF = discounted cash flow) is $160.
On the right hand side of the table, the CLV figures are shown for an existing customer using the above formula.
As you can see, there is NO acquisition cost (as they are already a customer), and we essentially start the customer in Year 2 with a annual margin of $180 (which is 60% of Year One’s $300 – note the two highlighted yellow cells).
In this case, the customer value (after discounting) is $360. This is also what the above formula tells us:
The main concern with this approach to calculating customer lifetime value is its use of static values. Firstly, it assumes a stable margin (annual customer profit), which is generally unlikely (please see article on increasing customer revenues). And secondly, it also assumes a stable loyalty rate over time, which again is generally unlikely.
That’s why the free CLV Excel template available on this website allows for flexible revenues, costs and margins over time.
So why use this CLV formula?
CLV = (m.r)/(1+d-r) is appropriate as a simple estimation of future customer value. It can be easily applied to a customer database (say in a spreadsheet format) where the customer’s profit/margin for the year is listed, along with an estimated loyalty/retention rate.
This CLV value becomes a forward-looking metric that a marketer can use to determine the financial viability of various cross-selling and loyalty focused marketing tactics.
Are you measuring the CLV of existing or new customers?
Customer lifetime value calculations, and the most suitable CLV formula to use, will vary depending upon what type of customer that you are attempting to measure. To make this point quite simply, there are two main types of customers that we are seeking to measure for customer lifetime value purposes, which are:
Existing (current) customers, or
Potential (new) customers (which will also include re-acquiring lost or lapsed customers).
Key CLV formula differences between existing and potential customers
There is a significant different in the CLV calculation for these two categories of customers. The most significant difference is in regards to the treatment of the acquisition cost. Obviously, existing customers have already been acquired – hence their acquisition cost is essentially a sunken cost that we would not take into account. Whereas new/potential customers still need to be acquired and will incur an acquisition cost.
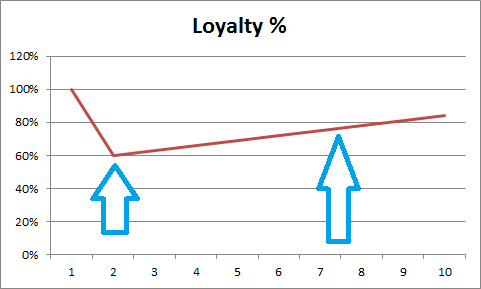
The second difference is that the loyalty (retention) rate of existing customers is likely to differ between existing and new customers. To make sense of this retention rate difference, let’s consider this graph of customer loyalty over time.
The first arrow on the left shows the loyalty rate for (new) customers after the first year of just 60%, whereas the arrow on the right shows the loyalty rate of existing customer (in years 7-8) approaching 80%.
So why does this happen? When you think about it, the loyalty rate pattern makes logical sense.
At the start (year 1), new customers are essentially trialing the brand’s/firm’s offering. If they are dissatisfied (or a consumer more prone to switching), then they are more likely to churn (switch or lapse) early in their brand relationship. However, if they are satisfied with their initial purchase and remain loyal after the first year, it is likely that the loyalty rate of the remaining customers will increase over time (as the less satisfied customers decide to discontinue or switch brands).
Example of different CLV calculations: New versus existing customers
To make the customer lifetime value calculation as simple as possible, let’s assume:
The acquisition cost of new customers is $1,000
The customer profit (revenues less appropriate costs) is $500 per year
The loyalty rate of new customers is 60% (as per the above table, which = 2.5 years)
And the retention rate of existing customers is 80% (say for year 9 in the table above, which = 5 years)
Therefore, the customer lifetime value of NEW customers would be:
$500 X 2.5 years, less $1,000 = $250
And the CLV of EXISTING customers would be:
$500 X 5 years = $2,500
What do these CLV results mean?
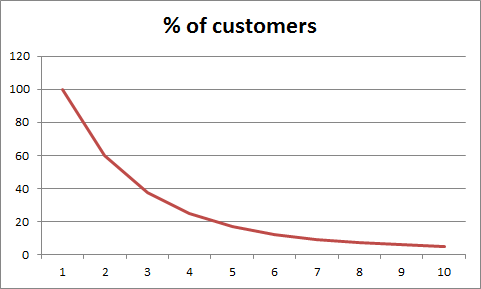
As you can see, the customer lifetime value for existing customers is 10 times the value for new customers. However, this is to be expected. Due to the loyalty rate pattern for this example (60% increasing to 80%+ retention), there is only a small number of existing customers after ten years.
Let’s now look at the percentage of customers that actually remain loyal for ten years (even with a retention rate of 60-80%). As you can see in the graph, only around 5% of customers are still with the firm/brand at the ten year mark.
These customers are highly loyal (most probably due to choice, rather than habit at this stage) and therefore should be quite profitable ongoing.
And compared to the less loyal newer customer, their CLV figure will be naturally higher. But keep in mind that within every cohort of new customers there will be very short-term low value customers, as well as a small number of long-term high value customers.
Impact on new versus existing customer acquisition strategy
Based on the differing CLV’s of new versus existing customers, there is possibly a suggestion that the best strategy would be to focus on existing customer only. But you are probably aware of the leaky bucket theory – which suggests that even with high retention rates there will always be a drain on customer numbers (as illustrated in the previous chart).
Therefore, the clear strategy should be to continue with new customer acquisition, with the intent of identifying (or creating) the long-term, high value customer than underpins the ongoing profitability of the firm or brand.
The accounting challenge of customer lifetime value
One of the key challenges with communicating the benefits of customer lifetime value (CLV) as a key marketing metric is its alignment (or perceived lack of) with the firm’s overall profitability.
Take for example, a marketer who has determined that the firm’s CLV is $300 (before taking into account the initial $200 acquisition cost) and the marketer has also worked out that the average customer retention rate is 75% (or four years on average). The marketer could then argue that an acquisition cost of $200 per new customer (leaving a net CLV of $100) would be quite acceptable and would actually deliver a good marketing ROI of 50% ($100 profit/$200 acquisition cost – not including a discount rate).
Enter the accountant: who then points out that the firm made $2 million last year and that the firm has a customer base of around 40,000 customers – which clearly shows that each customer only makes $50 per year for the firm ($2m/40,000). Therefore, according to the accountant it doesn’t make sense to acquire customers at a $200 each – when they only make $50 per year and last only four years – “the firm would be lucky to break-even doing that“.
This would not be an uncommon situation for a marketer – so how do we reconcile the $100 customer lifetime value with the average $50 profitability quoted by the finance expert? Let’s have a look in the next section.
Aligning CLV to Overall Profitability
The problem with the above discussion is that the position is confused by the firm’s fixed costs and the overall acquisition (marketing/promotion) budget. So let’s reconcile customer lifetime value and the accounts.
The firm made a profit of $2 million last year
The firm had fixed costs of $800,000
And they had a marketing/acquisition budget of $200,000
Therefore, their profit BEFORE fixed costs and new customer acquisition costs was $3 million
So what does this $3 million profit represent? This is the profit generated by the current/existing customer base for the year. We have removed the fixed cost component and we have removed the investment in new customers. Therefore, this is the key financial number to get to = which is profit contribution of the existing customer base. So now we can continue our accounting and CLV connection.
The profit contribution of the existing customer base was $3 million
The firm has a 40,000 customer base
This means that each customer contributed $75 in profits (on average)
The average customer lifetime is 4 years
$75 (per customer profit) X 4 years = $300
Yes, we are back to the $300 customer lifetime value amount quoted by the marketer initially. So the marketer is right, the firm can spend $200 on customer acquisition, as they will make $300 back – every new customer is worth a net $100 to the firm.
An approximate customer lifetime value metric
Given this reconciliation of profits and CLV above, we should be able to work backwards as well and construct a ball park estimate of customer lifetime value using the firm’s top level financials (although I would suggest that you use the Excel template on this site to ensure greater accuracy).
As an example of this approximate CLV metric:
A firm made $10 million in profits
Add back their fixed costs, say $4m = $14 million
Add back their marketing budget, say $1m = $15 million (profit from existing customers)
Divide by their customer base, say 100,000 = $150 (profit per customer)
Multiply by average customer lifetime, say 5 years = $750 (CLV before any acquisition costs)
This is possible metric that you could use to:
Verify/ball park check your own CLV calculations
Set targets for improving CLV – e.g. if profits are to increase by $1m, what does CLV need to get to?
Estimate competitor customer lifetime values
Help in setting CLV targets for increasing profitability
If you look at the 2nd way you could use the CLV “appropriate” metric above, you can see it can be used for setting a customer lifetime value goal/target. Let’s continue with the above example and figures to see how that would work.
Firm’s profit of $10m, with a goal of increasing to $11m
Without any other major changes, this would mean that the profit contribution from the customer base would need to increase from $15m to $16m
If the customer base remains at 100,000 – then profit per customer per year needs to go from $150 to $160
With the 5 year average lifetime, total CLV (before acquisition costs) needs to increase from $750 to $800 (assuming acquisition costs per customer remain the same)
As you can see – the $10 increase in profit ($150 to $160) X 100,000 customers = $1 million profit increase. But that’s just a guide – our task, as the marketer, is to increase CLV from $750 to $800, and that increase could be achieved by:
Increased revenue per customer
Decreased costs of supplying/servicing the customer
Decreasing retention costs per customer
Increasing loyalty (lifetime) per customer
Decreasing the acquisition cost (more customers/same spend)
And, of course, we could grow the customer base instead – but the purpose of this article is to discuss CLV considerations.
How to calculate customer lifetime value (CLV) for a bank
Having had a corporate background in banking, I found that customer lifetime value was a key marketing metric in the finance sector. This is because banks (and other financial institutions) will hold customers for a long period of time and the customers will go through phases of their relationship – ranging from highly profitable to minor (or even negative) profitability.
Banks tend to focus a considerable amount of their marketing efforts on trying to build more profitable relationships with existing customers. Essentially direct marketing and relationship marketing efforts are used to:
Retain the loyalty of the customer (greater customer lifetime in years)
Increase the value/profitability of the customer (through up-selling and migration to higher value products).
The ROI on the investment in the various direct and relationship marketing efforts can be measured quite effectively using a customer lifetime calculation. To assist in this CLV calculation for a bank, a free customer lifetime value Excel template has been provided on this site.
The customer lifetime value calculation for banking
Customer lifetime value is calculated primarily the same way for a bank as it is for the main CLV calculation. Please refer to additional information on this website as required – please navigate by the above menu.
The key inputs into the customer lifetime value (CLV) banking calculation include:
Average balances of loans and savings on a per customer basis
Average interest rate margin (as a percentage)
Average income/revenue per customer generated from non-interest income sources (e.g. fees, commissions, and other sales)
Costs of providing customer services and access (which would include transaction costs, statement costs, and potentially a provision for infrastructure costs, and so on)
These inputs are used together to determine average annual profit on a per customer basis. This information is then combined with customer retention rates, other costs of retention and up selling, as well as initial customer acquisition costs – to determine the customer lifetime value (CLV) for the bank.
This is all calculated automatically for you in the Excel template for customer lifetime value for banks – which is available above for free download.
How average interest margin is used in the calculation
The customer lifetime value formula has been discussed elsewhere on this website, and probably the most significant difference for the banking customer lifetime value calculation is the handling of the interest rate margin in the determination of CLV.
If you look closely at the free Excel template of the CLV banking calculation, you will note that the profit generated from the average balance multiplied by the interest rate margin is then divided by two. Why is this necessary?
It is necessary to ensure that profits are not double counted in the calculation of customer lifetime value (CLV). As we know, banking involves the matching of depositors and borrowers – so let’s look at the following simple example.
Simple CLV Banking Example
Let’s assume we have just two banking customers (in order to make the calculation straightforward). The first customer has $10,000 in a savings account at 6% pa interest and the second customer has a loan for $10,000 at 10% pa interest.
In simple terms, our net interest margin is 4% (10% less 6%). Assuming interest only repayments, the bank would generate $1,000 in interest revenue from the borrower and then pay $600 in interest expense to the depositor. This is a $400 per annum profit for the bank, which is equivalent to our 4% net interest rate margin.
However, because there are two customers involved, this $400 profit amount needs to be divided by the two customers. This means that each customer helps generate $200 in profitability.
Therefore, this is why the interest income is divided by two in the customer lifetime value calculation.
Totaling Savings and Loan Balances
Because of the manner in which the spreadsheet handles the CLV calculation for a bank, it is then a simple manner to take the bank’s total loans and total deposits and add them together to determine the total combined portfolio. This total portfolio can then be divided by the total number of customers to calculate average balance, as shown in the following example.
Bank’s total loans = $400m
Banks’s total deposits = $600m
Added together = $1b total portfolio
Bank’s customer base = 50,000 customers
Can then calculate average balance $1b/50,000 (total portfolio/number of customers) = $20,000 average balance per customer
This simple approach ensures that all balances from all customers are included. For example, say a customer had $1,000 in savings and a $1,000 loan – then this approach would count $2,000 in their average balance – say at a 4% net interest margin (see above), then divided by two = $2,000 X 4% / 2 = $40 per year profit contribution.
Determining Net Interest Rate Margin
This is normally a key financial metric for a bank so it should be easy to find in their annual reports, but a simple way to calculate it is:
Net interest income/average total assets for the year
Return on marketing investment: A Case Study of the Domestic Airline Industry in India (research paper)
This is an excellent research paper, ideal for anyone seeking a more detailed understanding of customer equity and customer lifetime value. The paper also provides good insight into the airline industry in India, as one of the co-authors is employed in the industry.
The paper constructs a framework for the integration of marketing strategy with customer lifetime value and customer equity within the airline industry. It has a significant return on marketing investment focus.
For a better understanding of the case study, here two paragraphs from the abstract of the research paper.
The authors present a practical model that can be of help to airline managers to trade off competing marketing initiatives and make them accountable. The model enables airlines to calculate ROI for any prospective marketing investment and to evaluate the realized ROI. The framework is based on the effect of marketing initiatives on firm’s customer equity, which is the sum of lifetime values of airline’s current and future customers. Each customer’s lifetime value results from the frequency of flying, average price of ticket, and brand switching pattern, combined with the firm’s contribution margin.
The drivers of customer equity include value (quality, price, convenience), brand (brand image, brand awareness) and relationship (loyalty program, CRM, knowledge of passenger). Airlines may analyze drivers that have the greatest impact, compare performance on those drivers with that of competitors, and project ROI from improvements in those drivers. The framework enables “what-if” evaluation of marketing ROI, which can include such criteria as return on service quality, return on advertising, return on loyalty programs, and even return on corporate citizenship, given a particular shift in customer perceptions. This enables the firm to focus marketing efforts on strategic improvements generating the greatest return.
Return on marketing investment: A Case Study of the Domestic Airline Industry in India by Dr. S C Bansal (Associate Professor at the Indian Institute of Management), Dr. Mohammed Naved Khan (Senior Lecturer Department of Business Administration Faculty of Management Studies & Research Aligarh Muslim University Aligarh) and Dr Vippan Raj Dutt (Manager, System/Maintenance, IT Department at Indian Airlines Limited.
And you can also download their supporting PowerPoint presentation here IIMA-ROMI_Presentation, which was presented at the “Return on Marketing Investments” conference jointly conducted by the Indian Institute of Management, Ahmedabad and Zyman Institute of Brand Science at Goizueta Business School, Emory University.